
Despite a good start to 2026 through February, stocks broadly declined in March due to the Iran War and fears of artificial intelligence’s impact on employment and the threat to some companies’ livelihoods. The S&P 500’s quarterly performance is negative 30–35% of the time but it hadn’t happened since the third quarter of 2024. Bond returns were muted in the first quarter as slightly higher interest rates offset the interest paid to bondholders.
Global Equity Markets
| Returns | 2026 YTD (Local) | 2026 YTD (USD) | 2025 (Local) | 2025 (USD) | 15 Years (Ann.) |
|---|---|---|---|---|---|
| Regions | |||||
| U.S. (S&P 500) | – | -4.3% | – | 17.9% | 13.3% |
| AC World ex-U.S. | 1.1% | -0.6% | 25.1% | 33.1% | 6.1% |
| EAFE | 0.3% | -1.1% | 21.2% | 31.9% | 6.8% |
| Eurozone | -2.4% | -4.2% | 24.7% | 41.3% | 6.8% |
| Emerging Markets | 2.2% | -0.1% | 32.1% | 34.4% | 4.1% |
| Selected Countries | |||||
| Japan | 3.0% | 1.5% | 24.7% | 25.1% | 7.3% |
| UK | 4.0% | 2.0% | 25.8% | 35.1% | 6.3% |
| France | -3.5% | -5.4% | 14.2% | 29.5% | 6.7% |
| Canada | 3.3% | 1.4% | 30.9% | 37.4% | 6.4% |
| Germany | -6.6% | -8.4% | 20.9% | 37.1% | 6.1% |
| China | -8.5% | -8.9% | 30.7% | 31.4% | 3.2% |
| Taiwan | 11.1% | 9.1% | 34.0% | 39.8% | 13.9% |
| Korea | 24.1% | 16.7% | 96.5% | 100.8% | 6.8% |
| India | -13.6% | -18.1% | 9.5% | 4.3% | 4.8% |
| Brazil | 14.5% | 19.2% | 35.6% | 50.4% | 0.7% |
Source: J.P. Morgan
Fixed income market dynamics
| U.S. Treasuries | Yield | Return | Avg. Maturity | Correlation to 10-year | Correlation to S&P 500 | |
|---|---|---|---|---|---|---|
| 3/31/2026 | 12/31/2025 | 2026 | ||||
| 2-Year | 3.79% | 3.47% | 0.23% | 2 years | 0.75 | 0.03 |
| 5-Year | 3.92% | 3.73% | -0.14% | 5 | 0.94 | 0.03 |
| TIPS | 1.70% | 1.69% | 0.26% | 7.2 | 0.75 | 0.37 |
| 10-Year | 4.30% | 4.18% | -0.31% | 10 | 1.00 | 0.00 |
| 30-Year | 4.88% | 4.84% | -0.14% | 30 | 0.94 | -0.04 |
| Sector | ||||||
| U.S. Aggregate | 4.57% | 4.32% | -0.05% | 8.2 | 0.91 | 0.30 |
| IG Corps | 5.14% | 4.81% | -0.54% | 10.4 | 0.70 | 0.51 |
| Convertibles | 5.14% | 6.13% | 3.04% | – | 0.02 | 0.85 |
| U.S. HY | 7.40% | 6.53% | -0.50% | 4.8 | 0.13 | 0.79 |
| Municipals | 3.77% | 3.60% | -0.18% | 13.4 | 0.73 | 0.32 |
| MBS | 4.83% | 4.63% | 0.40% | 7.1 | 0.83 | 0.30 |
| ABS | 4.94% | 4.69% | 0.71% | 2.2 | 0.40 | 0.30 |
| Leveraged Loans | 8.80% | 8.10% | -0.44% | 4.7 | -0.21 | 0.61 |
Wars make investors nervous, but in the past they haven’t had much impact on global economies and in fact, one year post-event, stocks are usually higher. Exceptions are when there are troubled economies that coincide with geopolitical events. If you have a three-year horizon, stocks have always grown post-event.
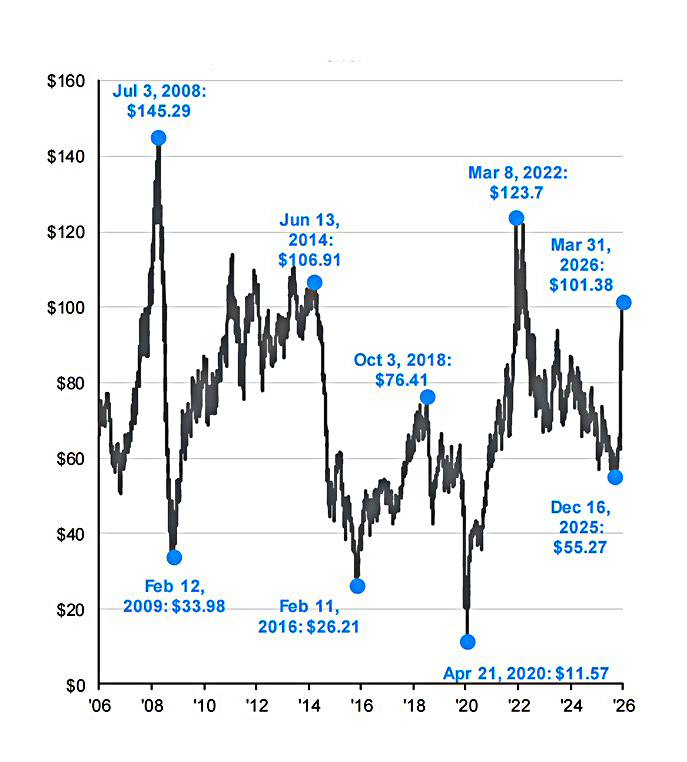
The war in the Middle East has spiked oil prices but we’ve been here before and on an inflation adjusted basis, $100 barrel oil isn’t all that high relative to the peaks of the last 20 years. It is estimated that a $10 change in the price of oil impacts inflation by just 0.3%. Inflation today is just 2.4% but that could rise into the mid-3% range all else equal.
Stay the course amid geopolitical volatility
Geopolitical events often generate alarming headlines, but markets have absorbed such shocks more resiliently than expected.
S&P 500 intra-year declines vs. calendar year returns
| Event* | Date | 3 months before | 3 months after | 1 year after | 3 years after (avg annual) |
|---|---|---|---|---|---|
| Cuban missile crisis | 10/16/1962 | -0.4% | 14.4% | 32.1% | 20.7% |
| Kennedy assassination | 11/22/1963 | -2.0% | 12.5% | 27.8% | 8.0% |
| Gulf of Tonkin incident | 8/2/1964 | 4.1% | 3.3% | 6.1% | 8.3% |
| Yom Kippur war | 10/9/1973 | 8.7% | -14.4% | -35.8% | 1.8% |
| Soviets invade Afghanistan | 12/24/1979 | -0.4% | -6.6% | 33.1% | 15.1% |
| Reagan shooting | 3/30/1981 | 0.4% | -0.7% | -11.8% | 11.5% |
| U.S. Marines bombed in Lebanon | 10/24/1983 | -1.0% | 1.1% | 5.5% | 17.6% |
| Iraq invades Kuwait | 8/2/1990 | 6.0% | -10.4% | 14.1% | 12.1% |
| September 11th attack | 9/11/2001 | -12.6% | 4.4% | -15.5% | 2.7% |
| Iraq war | 3/20/2003 | -1.8% | 14.2% | 29.0% | 16.3% |
| Russia annexes Crimea | 2/20/2014 | 3.8% | 2.3% | 17.1% | 10.8% |
| Russia invades Ukraine | 2/24/2022 | -8.5% | -7.7% | -5.9% | 13.5% |
| Hamas attacks Israel | 10/7/2023 | -1.7% | 8.8% | 33.3% | 17.9% |
| U.S. and Israel attack Iran | 2/27/26 | 0.7% | ? | ? | ? |
Source: BlackRock, Bloomberg as of 2/28/2026. Events in this table represent a non comprehensive group of universally recognized major geopolitical events of the past one hundred years. Returns shown for events prior to 1989 are represented by the S&P 500 PR Index, which shows principal returns only (excluding dividends), from 7/16/1962 to 10/24/1986. Returns for these periods would likely be higher if dividends were included. Returns for events in 1989 or later are represented by the S&P 500 TR Index, which shows total return (including dividends), from 5/2/1990 to 2/28/2026. The indices mentioned are unmanaged indices that are generally considered representative of the U.S. stock market during each given time period. Index performance is for illustrative purposes only. It is not possible to invest directly in an index. Past performance does not guarantee or indicate future results.
And when markets do decline, as they do every year, they usually finish higher on the year. In the first quarter, the S&P 500 had declined 7% from peak to trough, very much a normal event.
Annual returns and intra-year declines
S&P 500 intra-year declines vs. calendar year returns
Despite average intra-year drops of 14.2%, annual returns were positive in 35 of 46 years
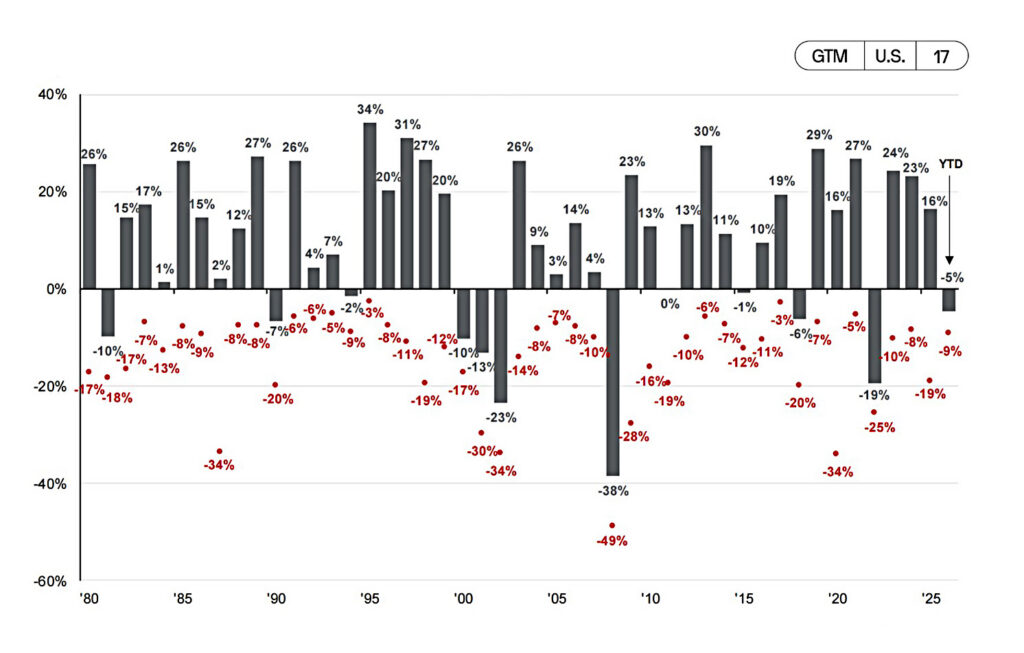
Source: FactSet, Standard & Poor’s, J.P. Morgan Asset Management.
Returns are based on price index only and do not include dividends. Intra-year drops refers to the largest peak-to-trough decline during the year. Returns shown are calendar year returns from 1980 to 2025, over which the average annual return was 10.7%. Past performance is no guarantee of future results.
Guide to the Markets – U.S. Data are as of March 31, 2026.
The war in the Middle East has spiked oil prices but we’ve been here before and on an inflation adjusted basis, $100 barrel oil isn’t all that high relative to the peaks of the last 20 years. It is estimated that a $10 change in the price of oil impacts inflation by just 0.3%. Inflation today is just 2.4% but that could rise into the mid-3% range all else equal.
Price of oil
Today, economies around the world are fairly healthy. Low inflation, unemployment, and healthy demand has created a pretty good business environment as witnessed by the Global Composite Purchasing Managers’ Index. Green means economic activity is healthy while red means economic decline.
Global economic activity momentum
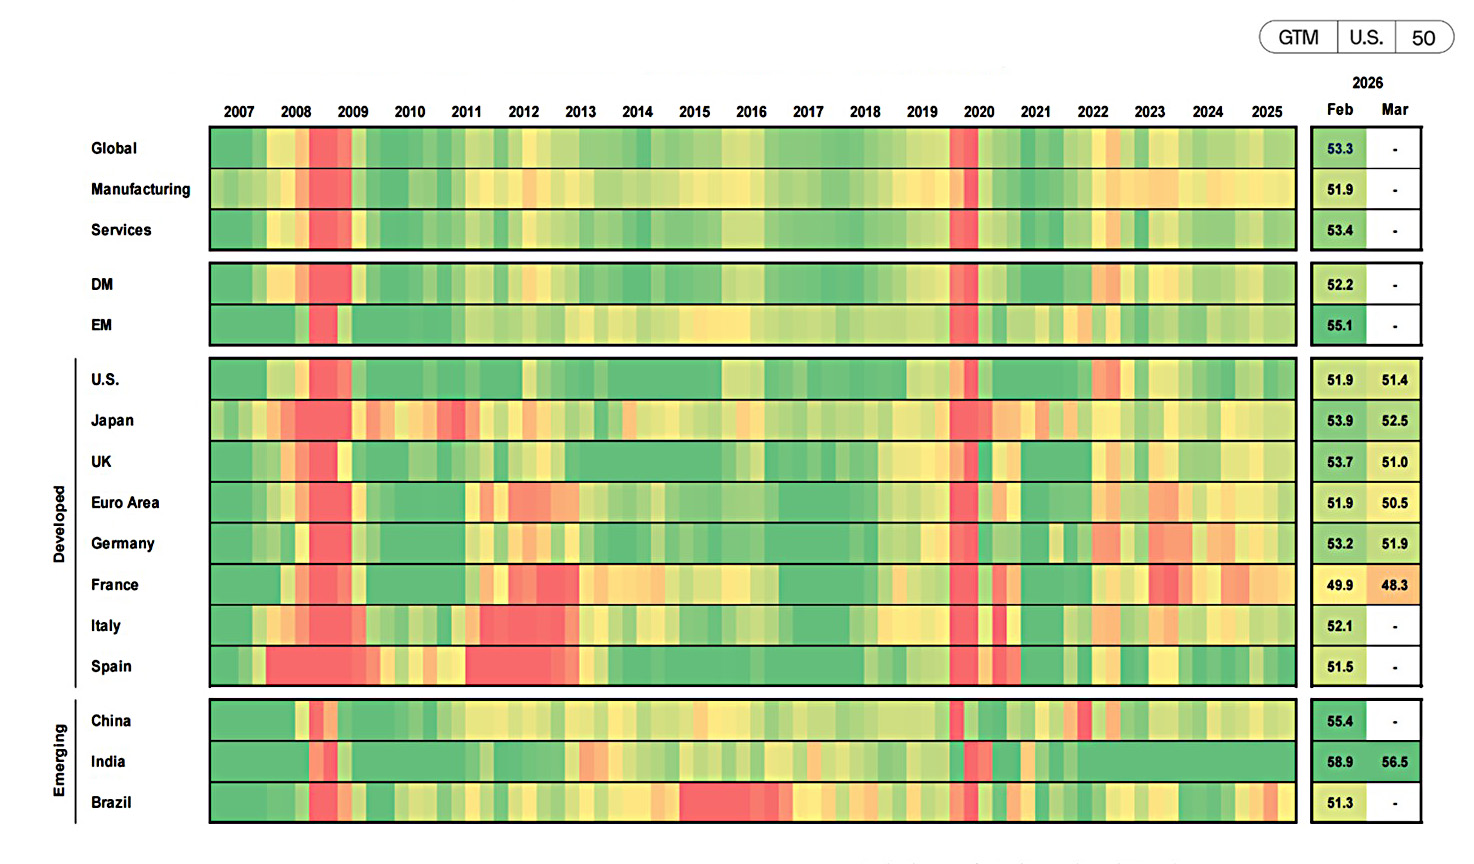
Source: J.P. Morgan Economic Research, Standard & Poor’s, J.P. Morgan Asset Management. Any italicized figures represent estimates by J.P. Morgan Asset Management. The Composite PMI includes both manufacturing and services sub-indices. Heatmap colors are based on PMI relative to the 50 level, which indicates acceleration or deceleration of the sector, for the period shown. Heatmap is based on quarterly averages, except for the two most recent figures, which are single month readings. Data for the U.S. are back-tested and filled in for 2007 to 2009. Data for Japan are back-tested and filled in for the first two quarters of 2007. DM and EM represent developed markets and emerging markets, respectively. Guide to the Markets – U.S. Data are as of March 31, 2026.
Given healthy global economies and stock markets that aren’t typically significantly impacted by wars, we recommend investors be vigilant and stay the course. Any changes to your investment strategy should be tied back to your financial goals and plans. If something has changed in your life (or is potentially changing), your wealth advisor is here to be a resource and sounding board in these sometimes confusing and scary times.
Disclosure: All investing is subject to risk, including the possible loss of the money you invest. Past performance is no guarantee of future returns. Diversification does not ensure a profit or protect against a loss in a declining market. There is no guarantee that any particular asset allocation or mix of funds will meet your investment objectives or provide you with a given level of income. The performance of an index is not an exact representation of any particular investment, as you cannot invest directly in an index.